


Graph Databases and Why You Should Care About Them
(Source: Shutterstock/Ton Snoei)
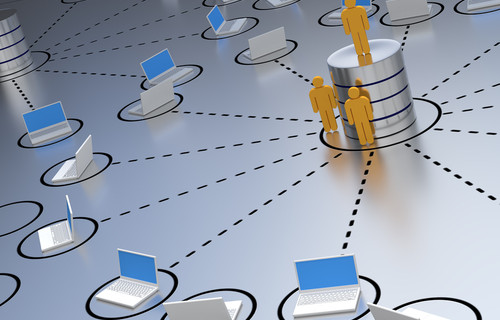
You use graph databases every day and probably don’t know it. Every time you visit LinkedIn and see first-, second-, or third-degree connections, you’re getting results from the social networking site’s professional network graph built on a graph database. Facebook, Instagram and Twitter all use graph databases and analytics to understand how users relate to each other and connect them with the right content. Every time you do a Google search, you’re tapping into Google’s Knowledge Graph. Those product recommendations on Amazon -- “people who bought this item also bought…” or “these items are often bought together”? That comes from a graph analytics query too.
Graph analytics allows for the deep exploration of complex interrelationships among various entities – organizations, people, transactions – pretty much any data that can be modeled and queried.
Gartner estimates that the graph database and analytics market will grow at 100 percent annually through 2022, making it one of the fastest growing markets in data and analytics. “Graph analytics will grow in the next few years due to the need to ask complex questions across complex data, which is not always practical or even possible at scale using SQL queries,” Gartner said.
Why Older Graph Technology Fell Short
Graph databases go back to the early 2000s, but for a long time they struggled to perform well with extremely large data volumes and when answers were needed in real time.
First-generation graph databases were built with native graph storage but were not made to handle large data or query volumes or perform beyond three levels or connections – known as hops -- inside the graph. With every hop in a graph, the scope of the search expands dramatically and the insights gleaned become deeper.
Second-generation graph databases were built on top of NoSQL storage, which allowed them to load large amounts of data. However, they still did not scale for queries involving three or more hops. One or two hops is surface-level insight, while multiple hops enable an exponential expansion in the amount of knowledge. This deeper level of analysis is what an organization needs to find hidden patterns in the data, gain a high-definition view of what the data says, and make predictions – all of which create competitive advantage.
Older graph databases also typically do not support “database sharding” – partitioning of data across a number of servers to increase scalability – which means a large graph with terabytes of data can’t be distributed.
These legacy graph databases are ill-equipped to scale up to today’s requirements for a system that can perform many hops efficiently and in parallel to deliver sub-second query performance on big data.
Shortfalls of Relational and NoSQL Databases
Relational databases also fall short because their architecture isn’t designed for this level of analytics.
RDBs store the data for each business entity, such as customer, order, product, and payment data – in separate tables. To understand and analyze relationships across entities, relational databases require table joins, which can take hours or days for the complex joins and are computationally expensive as the size of the data grows.
NoSQL databases store all of the data in a single table. This means that the relationship analysis requires scanning a huge table with millions or billions of rows, making it difficult to perform a deeper analysis of the relationships beyond two or three levels.
Graph Databases
Graph databases are purpose-built for storing and analyzing relationships among data. Data entities and the relationships among them are pre-connected and there is no need for specialized programming experts to execute time-consuming table joins or multiple scans across large tables.
The latest graph technology can traverse 10 or more hops – a four- or five-fold increase over earlier generations. This opens up new possibilities for such use cases as fraud detection, recommendation engines, artificial intelligence and machine learning, and many others.
Take corporate tax evasion. Graph databases able to dig 10 or more levels deep into a money trail can identify shell corporations that have similar or identical addresses, contact numbers, share one or more directors and have been created or administered from the same set of IP addresses. These are the kinds of interrelationships needed to track down cheats.
Healthcare is another example. With its ability to traverse and analyze oceans of data – data about members or patients, about prescribers, healthcare providers, hospitals and health records, about insurance claims and payments – graph technology can help assure high quality of care, control costs and detect and prevent waste and abuse.
In a digitized world awash in data, it has become vital to explore connections and relationships to see what they can tell us about everything from the products we are likely to purchase to who is committing crimes. A technology all of us are using every day is helping advance this important data science frontier.
Gaurav Deshpande is a vice president at TigerGraph. Previously, he spent 15 years overseeing marketing for IBM's AI, blockchain and cloud portfolios for the banking and financial markets, telecommunications and retail.


